
Hello,
")
The madness has officially arrived! As the 2026 NCAA Tournament bracket unfolds, VSiN is your ultimate command center for CBB bets and professional analysis. From the opening tips in Dayton to the National Championship in Indianapolis on April 6, we provide the data-driven edge you need. Whether you are hunting for college basketball picks for today's games or looking to hedge your NCAAB bets as the field narrows, our experts break down every matchup with precision.
April 5, 2026
March Madness Picks – Tuley’s College Basketball Takes for the National Championship After having to go through NCAA Tournament March Madness withdrawals in the Tuley’s...
April 5, 2026
College Basketball Picks Today: Expert college basketball handicapper Greg Peterson shares his top college basketball picks today for Monday, April 6. Check out Greg’s Daily College...
April 5, 2026
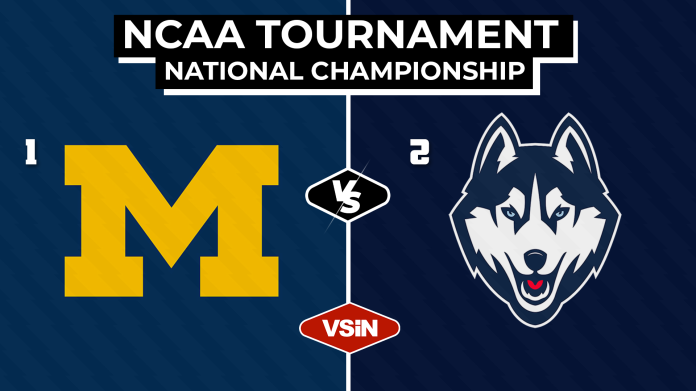
College Basketball NCAA Tournament National Championship Betting Trends: After a somewhat disappointing Final Four Saturday produced a pair of decisive games, we are down to...
April 5, 2026
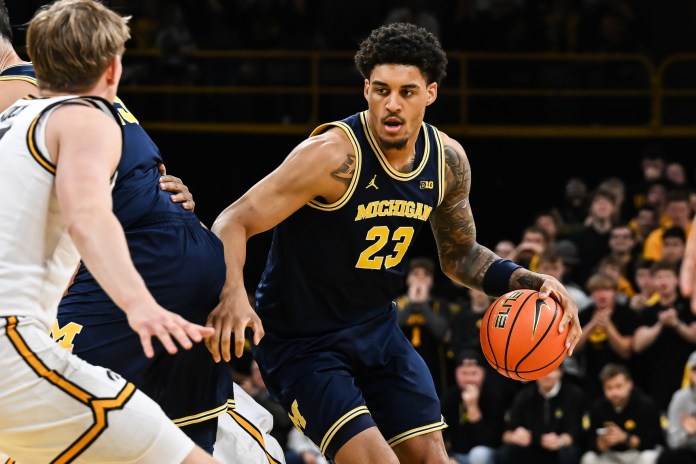
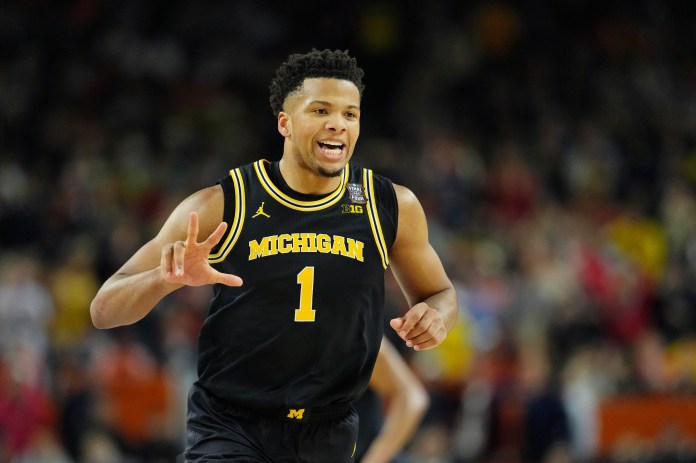
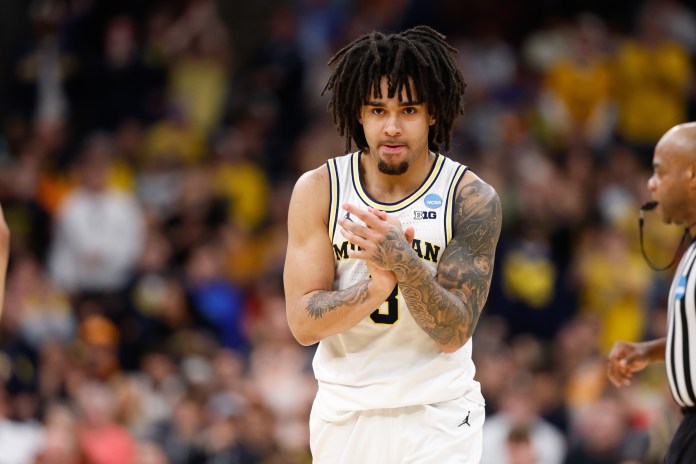
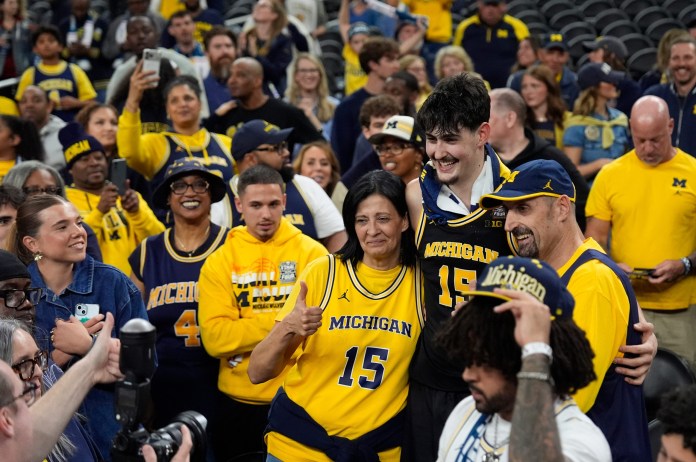
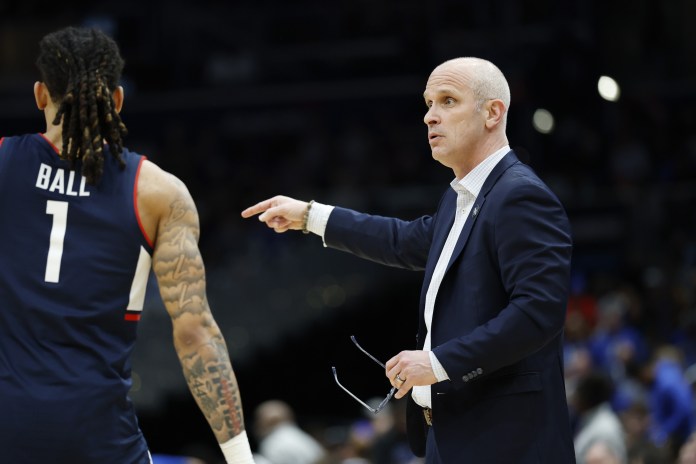
Michigan vs. UConn Prediction On Monday, April 6, the Michigan Wolverines and Connecticut Huskies will meet in the finals of the 2026 NCAA Tournament. This...
College Basketball, The VSiN Daily
April 5, 2026
🏀 Final Two It was a bit of a late night at Circa. I spent some quality time with Circa owner Derek Stevens, who was...
April 4, 2026
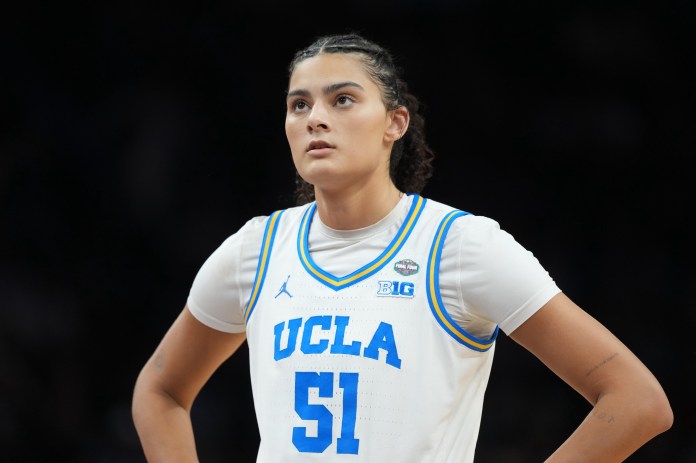
Women’s College Basketball National Championship Best Bets: South Carolina (-3.5) vs. UCLA, O/U 130.5 The stage is set; South Carolina has once again found its...
April 4, 2026
College Basketball Picks Today: Expert college basketball handicapper Greg Peterson shares his top college basketball picks today for Sunday, April 5. Check out Greg’s Daily College...
April 4, 2026
Today March Madness returns with a pair of NCAA Tournament Final Four matchups to choose from. Let’s examine where smart money is leaning for both...
College Basketball, The VSiN Daily
April 3, 2026
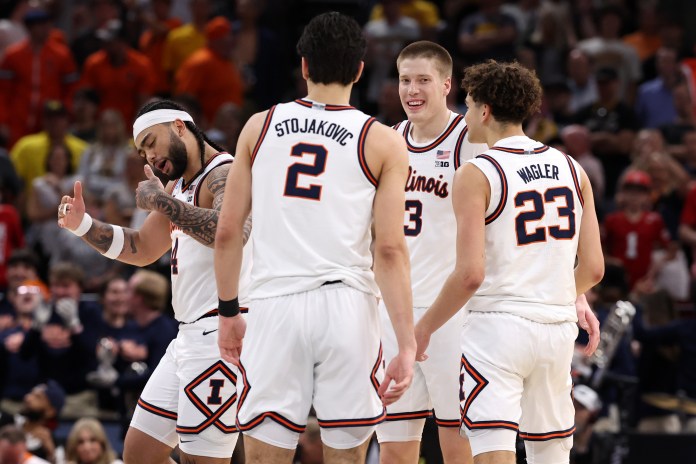
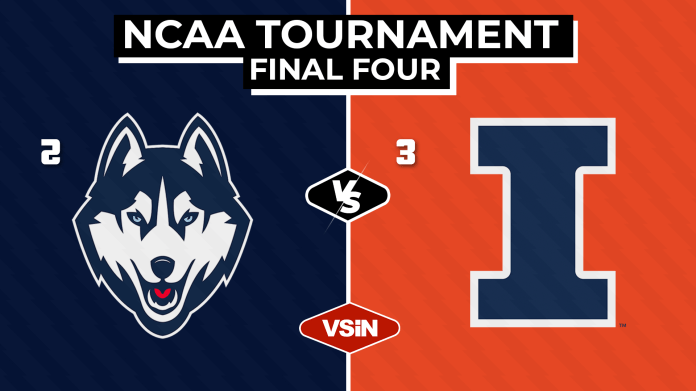
🏀 Final Four + Derby preps Greetings from Las Vegas on a holiday weekend. 🏀 NCAA Final Four (TBS) 👉 Illinois (-1.5) vs. UConn —...
April 3, 2026
UConn vs. Illinois Prediction UConn led Duke 2-0 in the first minute of the Elite Eight game last Sunday. They didn’t lead again until there...
April 3, 2026
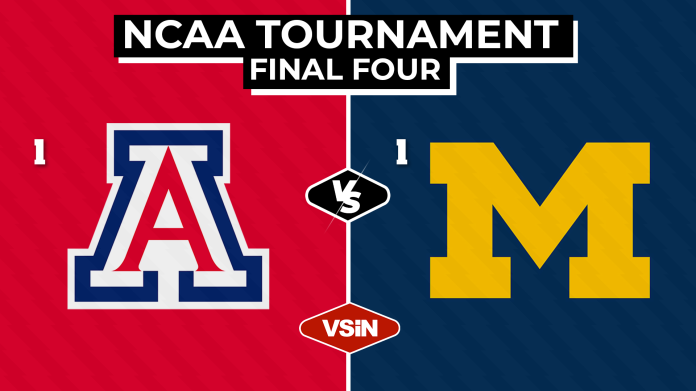
Arizona vs. Michigan Prediction Upsets and Cinderella stories make the NCAA Tournament endearing and engaging to the masses, but real ball knowers want this kind...
April 3, 2026
College Basketball NCAA Tournament Final Four Betting Trends: I continue the series qualifying the key data from my recently published articles in the VSiN March...
Postseason tournament play is where legends – and bankrolls – are made. Our college basketball picks for today’s slate are designed to navigate the unique volatility of single-elimination basketball. We are constantly monitoring the NCAAB odds for top-seeded favorites and high-value underdogs to identify the high-stakes matchups that define this time of year.
Our college basketball best bets today focus on trends and situational motivation. We identify teams with the defensive grit and perimeter shooting necessary to cover large spreads or pull off straight-up upsets, giving you a clear path for your CBB bets. If you’re looking for college basketball picks today, our analysis highlights the discrepancies between public perception and true basketball metrics. Don’t lock in your NCAAB bets until you’ve consulted our updated power ratings and injury reports for the current slate.
Winning your pool and hitting your CBB bets requires more than just picking the higher seed. Our college basketball predictions for today leverage advanced data to find guarantees and sleepers.
As the field narrows, our NCAAB predictions pivot to matchups and how teams adjust on short rest. With the March Madness odds shifting after every whistle, we provide real-time updates on college basketball betting lines for spreads, totals and player props. Trust our college basketball predictions to guide your NCAAB bets through the most volatile weekends in sports.
All roads lead to the ultimate goal: a trip to the Final Four and a chance at the title. Check back for National Championship odds throughout the tournament, while we follow the movement of favorites and longshots alike. As the bracket evolves, the NCAAB odds tighten, making it essential to identify value on the “Path to the Title” before the market adjusts.
Our Final Four predictions are updated at the conclusion of every round. We analyze the regional brackets to identify which programs have the most favorable route to the semi-finals. Whether you’re looking for CBB bets on the “Winning Seed,” specific regional winners, or NCAAB predictions for the championship game, our comprehensive college basketball odds coverage has you covered.
In a single-elimination tournament, volatility is the only constant. To succeed with your CBB bets, you must master the art of the “Live Hedge.” Our college basketball betting guides teach you how to use in-game NCAAB odds to lock in profits or mitigate losses during the frantic final minutes of postseason games.
For your NCAAB bets today, pay close attention to metrics we feature – stats that historically determine which teams cover the spread in March. By combining these professional tools with our daily college basketball picks, you can navigate the tournament with the confidence of a seasoned handicapper. Stay with VSiN through the final buzzer for the sharpest CBB bets in the industry.